C(t)=C0×n(t)−α×eμt,(1)
PR=2−α,(2)
LR=1−2−α.(3)
dN(t)/dt=F(t)[m−N(t)],(4)
N(t)´=[p+qmN(t)][m−N(t)].(5)
TC(S(t),x(t))=C(t)×x(t)+(V−M×L)×n(t)×T,(6)
S(t)+n(t)=180.(7)
r(t)=15∑22i=18x(t−i).(8)
S(t+1)=S(t)−x(t)+r(t).(9)
Therefore, the dynamic programming model of China’s CSP development under the minimum cost
{ft(S(t))=minx(t)∈g(S(t)){TC(S(t),x(t))+11+rft+1(S(t+1))}f2051(S(2051))=0,t=2050,…,2020.(10)
n(t)≤N(t),(11)
C(t)×x(t)+(V−M×L)×n(t)×T≤GDPt×u,(12)
(n(t)+x(t)2)×T≤(n(t−1)+x(t−1)2)×T×(1+g),(13)
C(t)=C0×n(t)−α×eμt ,(14)
n(t+1)=n(t)+x(t)−r(t),(15)
x(t)≥0t=2020,…,2050.(16)
TABLE 2
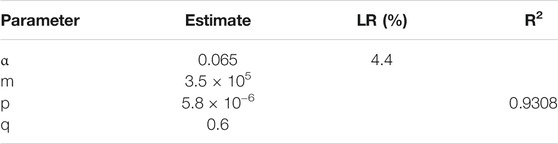
TABLE 2. Parameter estimation of the learning curve model and innovation diffusion model.
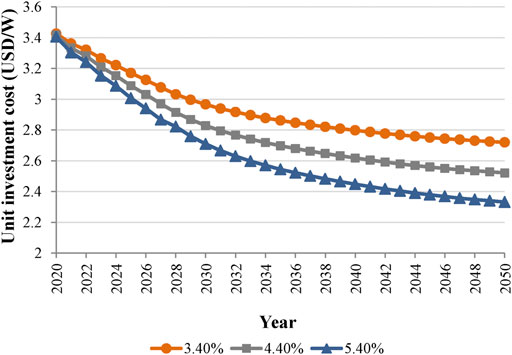
FIGURE 3. Unit investment cost changes under different learning rates.
Grid Absorptive Capacity
- Management School, Tianjin Normal University, Tianjin, China